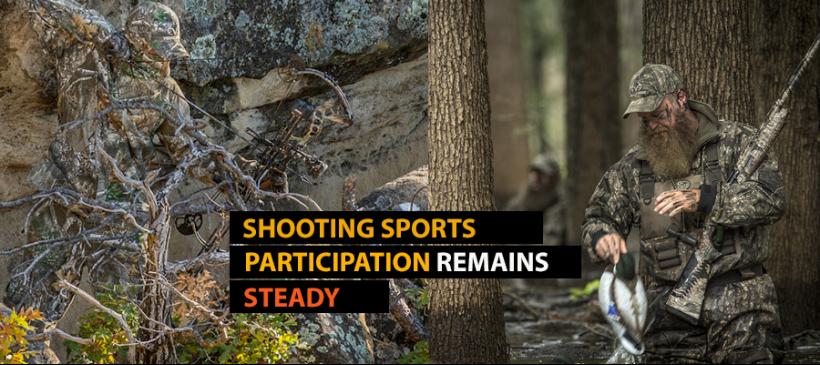
Shooting Sports Participation Remains Steady
- February 19, 2020
- By Team Realtree
- Research

The term “shooting sports” covers a wide variety of activities, and because it is so tightly tied to outdoor sports and recreation, it’s good to keep up with trends that measure information about the millions of people who fling arrows, hunt with gun or bow, or send lead downrange with rifles, shotguns and handguns.
The following summary, our fourth and final one in this series, breaks down recently released research from the National Sporting Goods Association. The organization keeps close tabs on 57 different sports and activities (categories) within 10 segments and then uses a Total Participation Points scale to lend weight to frequency of participation within the various categories. We’ve already looked at the Outdoor Recreation, Open Water and Fitness segments in past blogs.
The NSGA’s Shooting segment covers the categories of Target Archery, Bowhunting, Firearms Hunting, Muzzleloading and Target Shooting. It also includes Airgun Shooting and Paintball, but we’ll cover those activities separately another time. It could be argued that Bowhunting and Firearms Hunting are better matched to the Outdoors category, but the NSGA lumped them into the Shooting segment, so that’s how we’ll report on it here.
General Takeaways
The Shooting segment, when looked at via the NSGA’s Total Participation Points system, made a huge leap from the 1990s, when it scored an average of 53 TPPs for that decade, to a score of 64 TPPs during the 2000s. Thus far in the current decade, participation remains steady at 64TPPs. There was a total of 63 million participants in 2018, according to the study.
Target Archery
- This category boasted 7.7 million participants in 2018, with 4.9 million of them male and 2.8 million female. This is down slightly from this decade’s 2015 high of 8.4 million.
- The industry should take note of the fact that 1.5 million archery shooters were in the 12-17 age category in 2018, and another 1.2 million were 7-11. Finding ways to retain those participants as they age should be a part of every marketing plan.
- The study defines “occasional” participants in target archery as those who got out and shot 5-29 times per year, and that group represents 54.4% of all the shooters in this category. Frequent shooters (30 times or more annually) checked in at 11.6%, and infrequent (2-4 times) made up 33.9% of the group.
Bowhunting
- No one who makes a living in the outdoor industry should be surprised to hear that bowhunting continues to attract a healthy number of participants. Around 5.9 million bowhunters went to the woods in both 2017 and 2018. The high point for the decade was 2009 with 6.2 million participants.
- Those 5.9 million hunters are divided as 4.3 million male and 1.5 million female.
- Age is no barrier to bowhunting participation, with every age category well-represented. In 2018, some 1.4 million 25-34-year-olds bowhunted, followed by 1 million in the 34-44 age category, .8 million at 18-24 and .7 million at 45-54.
- Nearly two-thirds of bowhunters went out at least 5 times in 2018. Occasional (5-19 times) participants made up 49.7% of all bowhunters, while frequent (20 times or more) participants came in at 14.3% and infrequent participants made up the remaining 36.1%.
- The household income of bowhunters is diverse, with 2.7 million of them at $75,000 or higher, vs. 3.2 million below that income level.
Firearms Hunting
- As with bowhunting, we’ve reported on gun hunting numbers in this space consistently and frequently over the past few years. For a refresher on participation numbers, read our recent summary, Making Sense of Hunter Numbers.
- By the NSGA’s methodology, there were 17.5 million hunters age 7 and over in 2018. This is statistically even with 2017. The NSGA’s reported high for this decade was 19.4 million firearms hunters in 2012.
- The 25-34 age category leads in firearms hunting participation, with 3.1 million, followed by 35-44 and 45-54 with 2.9 million hunters each.
- Frequency of participation is very similar to the Bowhunting category, again with 49.7% getting out 5-19 times, 17.6% hunting frequently (20 or more times), and 32.7% infrequently (2-4 times per year).
Muzzleloading
- This is one category that has truly fallen off in recent times. From a high of 3.8 million participants in 2009, that number fell to 2.7 million in 2018. Interestingly, and a bright spot, is the fact that that’s where the number has remained every year since 2014.
- Participation frequency is virtually identical to Firearms Hunting participation (above).
- The 45-54 age group is the most avid, with .6 million participants.
Target Shooting
- This category includes handguns, rifles and shotguns. Some more detail about this category would have been useful to understand the difference between, say, handgun shooters who practice for proficiency versus shotgun shooters who participate in trap, skeet or sporting clays.
- At 20.1 million participants in 2018, target shooting has remained pretty much unchanged for the past decade.
- Another constant is the male-female ratio; 14.9 million shooters in 2018 were male and 5.3 million were female.
- The 25-34 age group made up 4.1 million of shooting’s participants last year. The 55-64 age group was next at 3.7 million; 35-44 was 3.2 million; and 45-54 came in at 3.1 million.
- Frequent shooters (20 times or more annually) make up 20% of target shooters. Occasional (5-19 times) shooters make up 44.5% of the category, and 35.5% are classified as infrequent (2-4 times).
Editor’s Note: Realtree, the world’s No. 1 camo company, wants to help you grow your business. We have solutions whether you’re a manufacturer, wholesaler or retailer. To find out how Realtree branding can help you increase sales, contact us today!
Check out our recent research blogs:
- Shooting Sports Participation Remains Steady
- Top 2018 Holiday Gift Categories and Brands
- Fitness Industry is No. 1 in Growth in 2018
- A Closer Look at 2019 Outdoor Sports Participation Trends
- Digging Deep into 2019 Outdoor Recreation Participation Stats
- Making Sense of Hunter Numbers
- Top 2018 Fishing Brands
- Top 2018 Hunting and Shooting Brands
- Saltwater Anglers Spend Big on Their Sport
- Freshwater Anglers Spend Big on Their Sport
