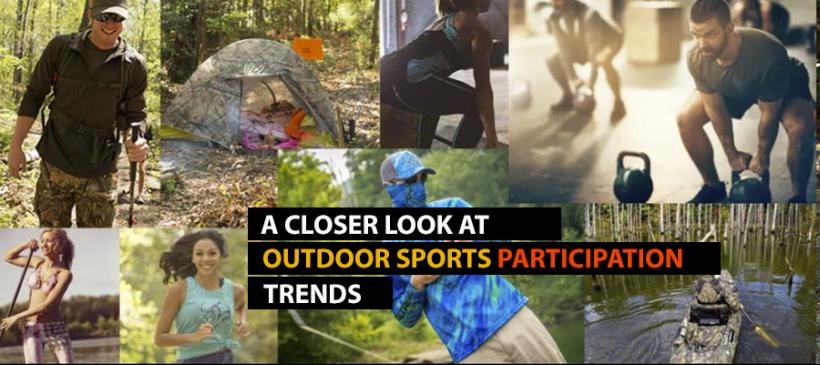
A Closer Look at 2019 Outdoor Sports Participation Trends
- June 12, 2019
- By Team Realtree
- Research
This is the first of several reports following up on a detailed look at sporting recreation in the U.S. as researched by the National Sporting Goods Association. As explained in our last blog on this topic, the NSGA is striving to find out not only how many participants are taking part in various activities, but also the depth of their participation.
The trade group’s study released in 2019 covers participation in 57 different sports and activities through 2018. We are focusing on four categories and the activities within them. First we’ll look at the Outdoor category. For the purposes of this study, there are five activities within Outdoor: Backpack/Wilderness Camping, Vacation/Overnight Camping, Freshwater Fishing, Saltwater Fishing and Hiking. (A case could certainly be made that Hiking should be in the Fitness category, or that Firearms Hunting should be in Outdoor instead of Shooting, but we’ll look at the categories the same way the NSGA did.)
The following information is presented here to help you gain more insight into the size of each market as well as the level of commitment that participants have to their activity.
General Takeaways
The Outdoor category, when looked at via the NSGA’s Total Participation Points system, has showed consistent, slight upward trending in the last five years:
2014: 131 million
2015: 134 million
2016: 134 million
2017: 137 million
2018: 138 million
A highlight in the Outdoor category is that there has been a notable increase in hiking participation, but that activity is offset a bit by a decline in vacation/overnight camping. Interestingly, only one other category of nine total reflected higher participation in 2018, and that was the Fitness category with 363 million TPP.
The Individual Sports category (i.e bowling, swimming, golf, etc.) follows third with 127 million TPP, and the Team Sports category is fourth with 103 million TPP. Here are details of the activities within the Outdoor category:
Backpack/Wilderness Camping
- About 12.2 million participants in 2018, which is statistically flat to 2009’s 12.3 million.
- Males make up 7.5 million of those participants, and females represent 4.7 million.
- The 25-34 age group is best represented in this category, with 3.2 million participants, followed by 34-44 at 2.1 million, 45-54 at 1.9 million, and 18-24 at 1.6 million.
- High earners are well-represented here, with one-third of participants having a household income of more than $100,000.
- 43.2% of participants camped infrequently (2-4 times), followed by occasional participants (5-19 times) at 42.1% and frequent participants (20+ times) at 14.7%.
Vacation/Overnight Camping
- As mentioned earlier, this category has seen a decline in the past decade, falling from 50.9 million participants in 2009 to 40.7 million in 2018.
- Males account for 22.4 million participants and females for 18.3 million.
- The age group 25-34 has the highest participation at 6.7 million, followed closely by 34-44 at 6.6 million and 45-54 at 6.4 million.
- “Occasional” campers (5-19 times) make up 46.5% of this category, followed by infrequent (2-4 times) and frequent (20+ times) at 12.4%
Freshwater Fishing
- With nearly 30 million participants, this is one of the biggest recreational categories. This number has remained steady for the past decade.
- The male:female ratio has also remained pretty consistent at 2:1.
- The 55-64 age group represented 5.6 million participants in 2018, followed by 45-54 at 4.9 million and 35-44 at 4.3 million.
- Participation frequency is strong; 44.9% fished occasionally (5-19 times) and 24.8% fished frequently (20+ times), with 30.4% infrequently (2-4 times).
Saltwater Fishing
- This is a strong category, with 2018’s 9.2 million anglers up by 1 million over 2009.
- As with freshwater, participation frequency is also strong, with 44.8% identified as occasional (5-19 times) and 16.1% as frequent (20+ times). Another 39.1% fish the salt infrequently at 2-4 times).
- Slightly more than one-third of participants have a household income of $100k+.
Hiking
As noted earlier, Hiking has an obvious upward-trending pattern in participation. This category is measured slightly differently, with “frequent” participation meaning 30 or more outings, “occasional” meaning 5-29 outings and “infrequent” meaning 2-4 outings. It’s probably not a stretch to surmise that the U.S.’s increased fitness participation drifts over into the Hiking category.
- There were 46.4 million hiking participants in 2018, a substantial increase from 2009’s 34 million.
- Male:Female participants are almost evenly divided, and have been for the past decade.
- Participation by age is an interesting statistic here. The Index (weighting participation in correlation to the whole universe of people in a given age group) is remarkably consistent; the five age groups between 18 and 24 are all within a few points of each other on the index scale. Therefore, participation, as a percentage of the population is very consistent across ages.
- Related to the point above, in raw numbers, the 25-34 age group has the most hikers at 8.3 million, followed by 45-54 at 8 million, 55-64 at 7.6 million, 35-44 at 7.2 million and 18-24 at 5.1 million.
- Folks who hike occasionally measure 60.2% of all hikers. Frequent hikers make up 14.8% of the group, and infrequent hikers represent 25% of participants.
The next blog post in this series will look at the Open Water sports category and the sectors of boating, canoeing and kayaking.
Editor’s Note: Realtree, the world’s No. 1 camo company, wants to help you grow your business. We have solutions whether you’re a manufacturer, wholesaler or retailer. To find out how Realtree branding can help you increase sales, contact us today!