
Saltwater Anglers Spend Big on Their Sport
- March 5, 2019
- By Team Realtree
- Research
Over the past couple weeks we’ve dug into some stats on the economic impact of sportfishing in the U.S., noting that anglers spent a whopping $49.8 billion on fishing gear and trips in 2016, according to a report from the American Sportfishing Association. Following our post on how anglers in the massive freshwater sector spend their money, here’s a look into the economics of saltwater fishing.
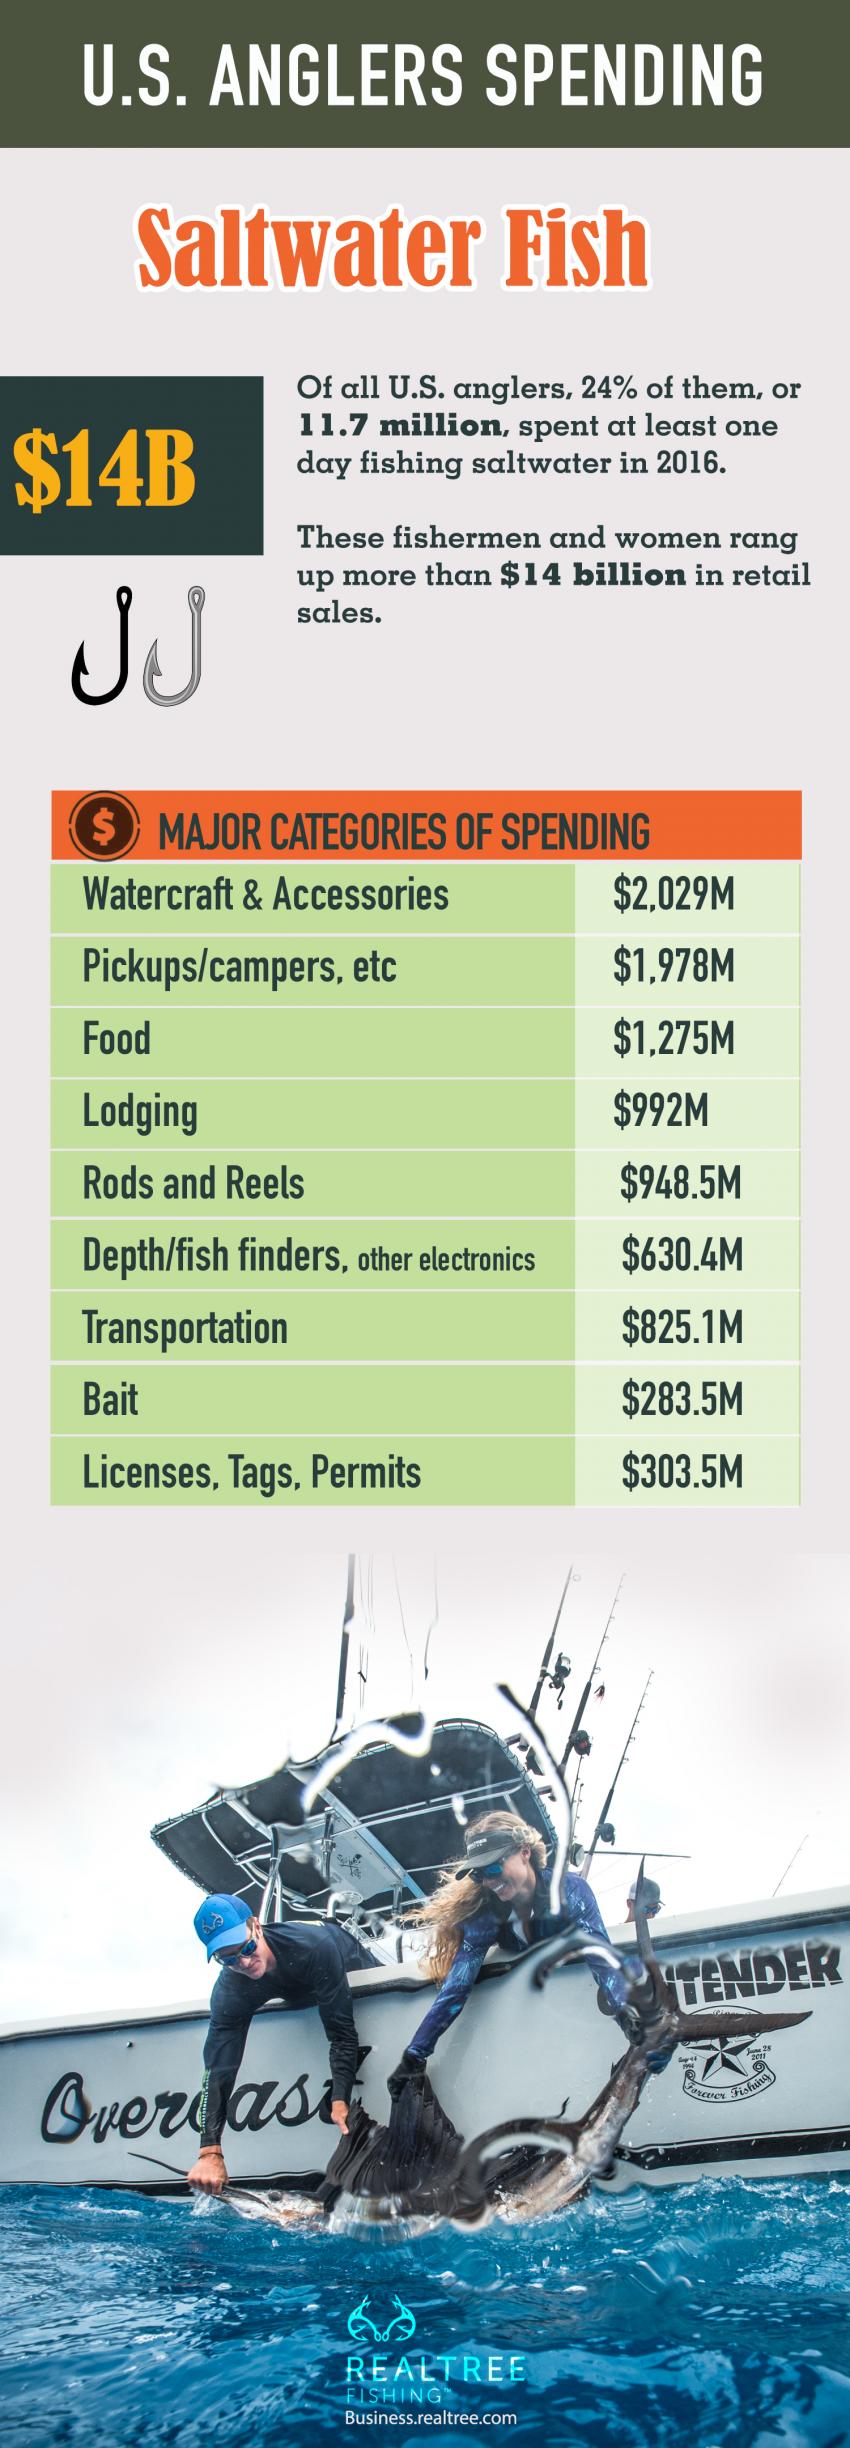
- Of all U.S. anglers, 24% of them, or 11.7 million, spent at least one day fishing saltwater in 2016.
- These fishermen and women rang up more than $14 billion in retail sales*.
- The U.S. Gross Domestic Product (GDP) contribution of saltwater fishing totals $18.3 billion. For comparison, that’s more than double the revenue of all Major League Baseball teams combined.
- All of that spending supports 228,700 U.S. jobs that pay $11,037,300,000 in salaries, therefore kicking in $2.7 billion in federal tax revenues and $1.9 billion in state and local tax revenues.
Notable spending by category for saltwater angling includes:
Travel $6,150,600,000
Vehicles/Boats $4,132,400,000
Fishing Gear $2,750,400,000
Some of the most eye-popping spending totals within the above categories include:
Watercraft & Accessories $2,029,500,000
Pickups/campers,etc. $1,978,400,000
Food $1,275,200,000
Lodging $992,000,000
Rods and Reels $948,500,000
Depthfinders/Electronics $630,400,000
Transportation $825,100,000
Bait $283,500,000
Licenses, Tags, Permits $303,500,000
These sample categories are presented here to put the scope of saltwater angling’s impact in perspective. They are based on 2016 reporting, the most recent available.
As mentioned in a previous post, multiple sources contribute to these calculations, which are compiled by Southwick Associates. These include the Outdoor Industry Association’s Outdoor Participation Report (2017), the U.S. Fish and Wildlife Service, and the Recreational Boating and Fishing Foundation 2018 participation report.
Also positive and noted in our last post on this topic but well worth repeating: The ability to detail the economic impact of angling is helped in part by the fact that in 2018, for the first time, the U.S. Bureau of Economic Analysis, the country’s official source for analyzing U.S. economic data, reported outdoor recreation as its own category. We now know that the outdoor recreation economy accounted for 2% of nation’s gross domestic product (GDP) in 2016 and that the category grew 3.8% that year, compared with only 2.8% growth of the overall U.S. economy.
*Economic and expenditure data presented here is based on spending by anglers age 16 and older, which represents 87% of all anglers.
Editor’s Note: Looking for a new way to bring attention to your brand? Then check out our newest brand, Realtree Fishing. We invite you to Contact Us today to find out how we can work together!
Check out our recent research reports:
- Saltwater Anglers Spend Big on Their Sport
- Freshwater Anglers Spend Big on Their Sport
- Spending on Sportfishing Continues Positive Upward Trend
- Economic Impact of Migratory and Upland Bird Hunting
- Rising Demand for Trail Cameras Continues
- Who is Today’s Rifle Hunter?
- Impact of Hunting on the U.S. Economy
- Top Sporting Goods Retailers for 2017
- Top 10 States With the Highest number of Deer Hunters