
Sporting Goods Purchases | Realtree Market Watch
- November 16, 2015
- By Randall Mueller
- Marketing

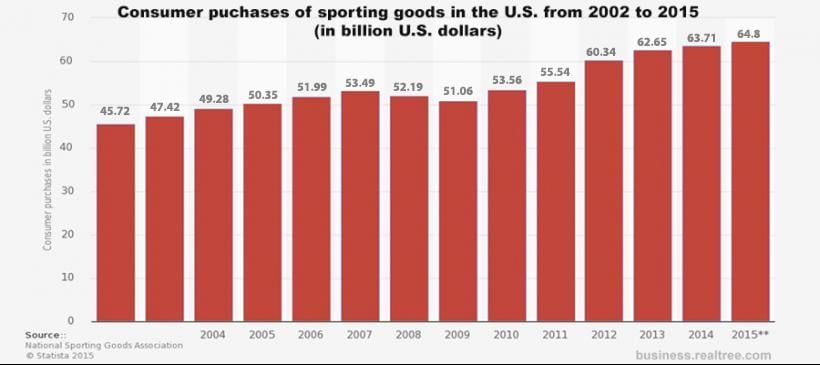
How big is the sporting goods market? This timeline chart from Statista, based on data from the National Sporting Goods Association, helps put things in perspective. In this case, “sporting goods” means equipment, footwear and clothing. (Click above to see the chart.)
U.S. consumer sales approached $64 billion in 2014, a $12 billion increase since 2008, and the forecast for 2015 is for that growth to continue to $65 billion.
A few callouts of interest for anyone with a stake in the sporting goods market:
· The sports equipment sector is the biggest sales category, with sales of $28 billion in 2014. Almost a quarter of the purchases in the sports equipment category came from sporting goods stores, and another 20 percent came from specialty sports shops.
· The footwear segment is the second-largest sector of the sporting goods industry. It has grown steadily in recent years, with consumer purchases now exceeding $20 billion.
· Over a quarter of footwear purchases are made by 45- to 64-year-olds, and another 18 percent of sales were made for or by consumers under the age of 14. Footwear sales tend to be evenly divided between males and females.
· Nike is the clear market leader in athletic footwear with revenue of $14.5 billion (2013 statistic), $5 billion more than its closest competitor, Adidas.
· Sports clothing makes up around $14 billion of the total sales, which is a $1 billion increase since 2010.
Editor’s Note: Realtree’s Outdoor Market Research Guide can give you additional perspective on opportunities to reach active-lifestyle consumers. Click here to download it for free.